Many companies still wait for weekly or monthly reports to understand sales, cash flow, inventory, expenses, employee performance, or customer activity. By the time the report is ready, the problem may already be bigger.
This delay creates confusion. Sales teams may not know which leads are pending. Finance teams may miss overdue payments. Inventory teams may continue purchasing products that are already available in stock. Management may only understand the issue after it has already affected profit, customer service, or operations.
This is where real-time business intelligence in ERP becomes important.
Instead of depending only on manual Excel sheets, WhatsApp updates, or delayed reports, companies can use live ERP dashboards to monitor what is happening across the business. With the right ERP setup, dashboards can show useful information from sales, finance, inventory, purchase, HR, projects, manufacturing, POS, and customer support in one place.
Modern businesses do not only need data. They need useful data at the right time.
What Is Real-Time Business Intelligence in ERP?
Real-time Business Intelligence in ERP means using live or frequently updated business data from the ERP system to create dashboards, reports, KPIs, and insights.
In simple words, it helps business owners, managers, and department heads see what is happening inside the company without waiting for manual reports.
ERP systems collect data from different departments, such as:
- Sales
- Accounting
- Inventory
- Purchase
- CRM
- HR
- Manufacturing
- POS
- Projects
- Website or eCommerce
When this data is properly entered and connected, it can be converted into useful dashboards. These dashboards help management understand performance, identify problems, and make better decisions.
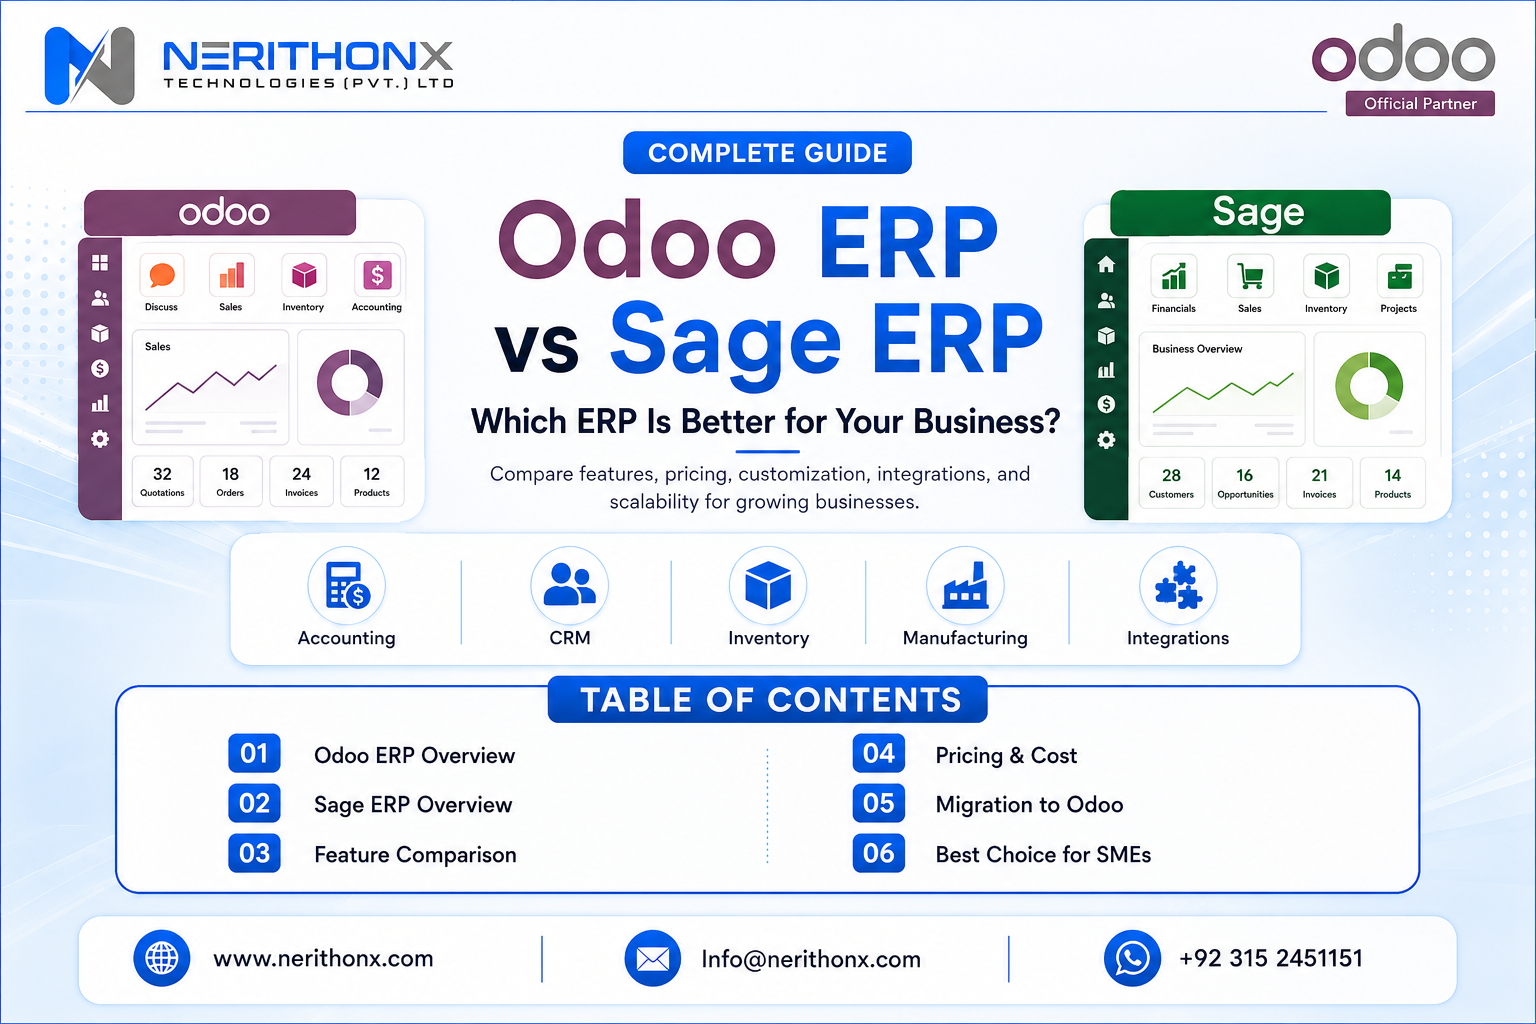
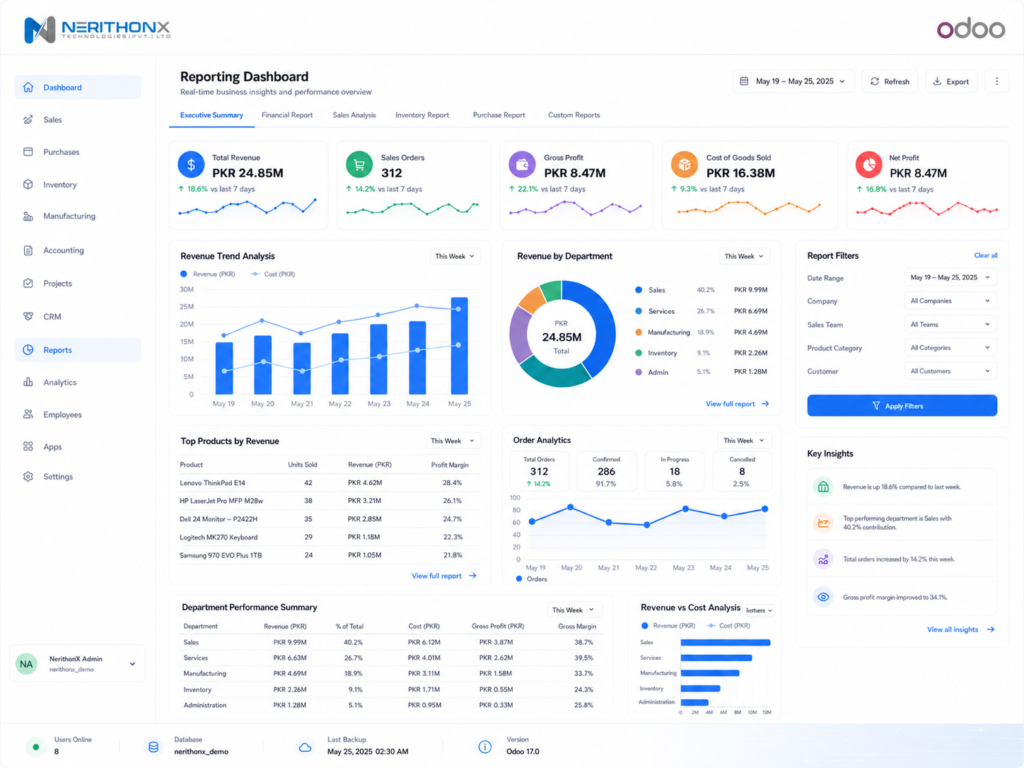
Odoo, for example, offers dashboards, reporting, pivot views, graph views, and spreadsheet-style reporting depending on the version, configuration, and implementation. Official Odoo documentation explains that dashboards can display real-time data from the Odoo database and centralize key business metrics in one place.
What Are Live ERP Dashboards?
A live ERP dashboard is a visual screen that shows important business information in an easy format.
Instead of opening multiple reports one by one, management can see key data on one dashboard. This may include sales revenue, payments, expenses, stock levels, pending orders, customer activity, project progress, or department performance.
A good ERP dashboard usually includes:
- Charts
- Graphs
- KPI cards
- Tables
- Filters
- Alerts
- Department-wise views
- Management summaries
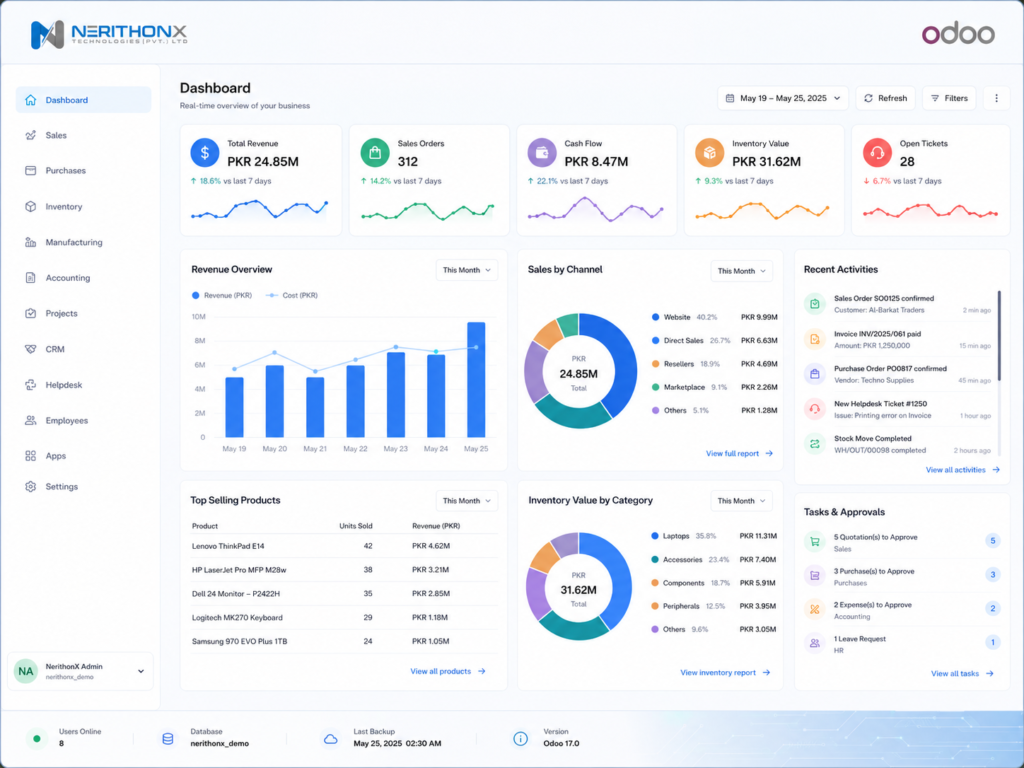
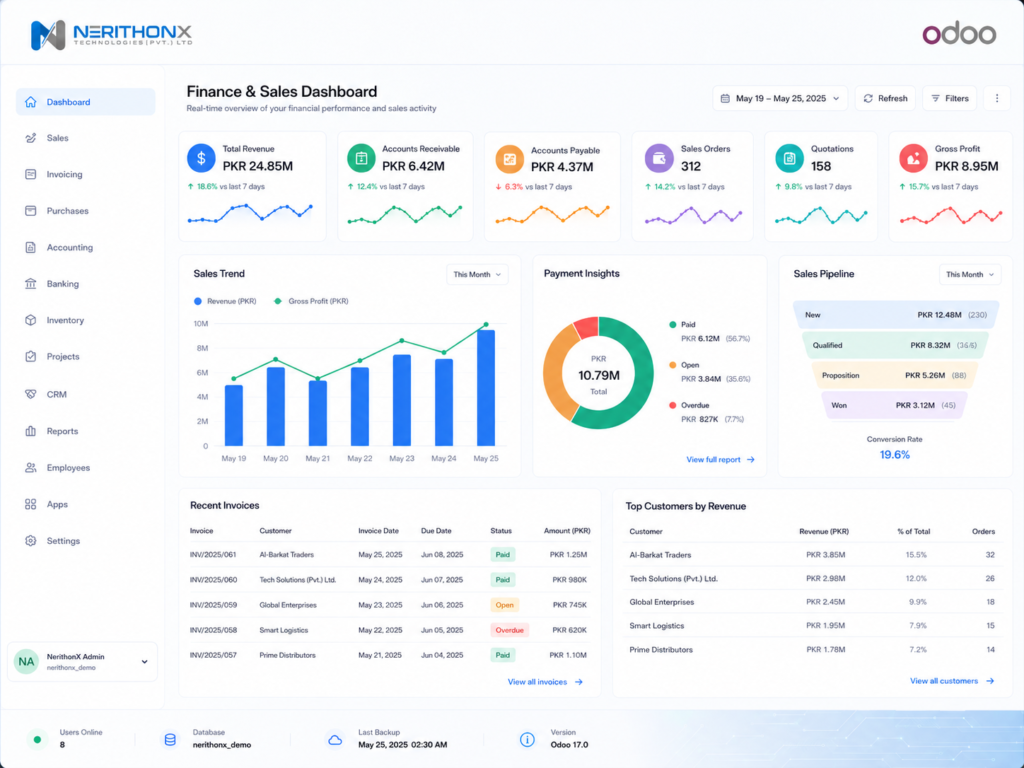
For example, a CEO dashboard may show total revenue, pending receivables, current expenses, cash position, sales performance, and inventory value. A finance dashboard may show invoices, vendor bills, bank balances, and monthly expenses. A sales dashboard may show leads, quotations, sales orders, conversion rate, and salesperson performance.
The main purpose is simple: help the right person see the right information quickly.
Traditional Reports vs Live Dashboards
Comparison Point | Traditional Reports | Live ERP Dashboards |
Report timing | Weekly, monthly, or manually prepared | Live or frequently updated depending on setup |
Manual effort | High manual work required | Less manual work after proper configuration |
Data visibility | Limited and delayed | Faster visibility across departments |
Decision speed | Slower decisions | Faster decisions |
Error risk | Higher risk due to manual entry and Excel handling | Lower risk when ERP data is properly maintained |
Department connection | Often disconnected | Connected with ERP modules |
Management use | Good for detailed review and audit | Better for daily monitoring and quick action |
Best use case | Final reports, audits, monthly reviews | Daily tracking, KPI monitoring, early problem detection |
Traditional reports are still useful for audits, detailed analysis, and official record keeping. But for daily business monitoring, live dashboards are more practical.
A report tells you what happened.
A live dashboard helps you see what is happening now.
Why Companies Need Real-Time Dashboards in ERP
Faster Decision-Making
Business decisions become stronger when management has updated information.
If sales are dropping, the sales manager can see it earlier. If stock is running low, the warehouse team can act before customers complain. If receivables are increasing, finance can follow up before cash flow becomes weak.
Live dashboards reduce the waiting time between problem and action.
Better Financial Visibility
Finance is one of the most important areas where dashboards help.
A finance dashboard can show:
- Customer receivables
- Vendor payables
- Cash position
- Invoices
- Vendor bills
- Expenses
- Monthly revenue
- Tax summary, where configured
This helps finance managers and business owners understand where money is coming from, where it is going, and what needs attention.
Without proper dashboards, many companies only discover financial issues after the month ends. With ERP reporting dashboards, they can track key financial indicators earlier.
Improved Sales Monitoring
Sales teams need visibility. Management should know how many leads are active, how many quotations are pending, how many orders are confirmed, and which salesperson is performing well.
A sales dashboard can show:
- Leads
- Quotations
- Sales orders
- Revenue
- Conversion rate
- Customer activity
- Salesperson performance
This helps companies improve follow-ups, reduce missed opportunities, and make sales teams more accountable.
Smarter Inventory Control
Inventory problems can directly affect profit.
If stock is too low, customers may not receive products on time. If stock is too high, business money gets blocked. If data is not updated, the company may purchase items that are already available.
An inventory dashboard can show:
- Stock on hand
- Low-stock products
- Fast-moving products
- Dead stock
- Warehouse performance
- Reordering needs
- Delivery status
For trading, distribution, retail, and manufacturing companies, inventory dashboards can improve planning and reduce confusion.
Stronger Operational Control
Operations teams handle daily work. This may include purchase orders, work orders, project tasks, delivery activities, support tickets, or production jobs.
A live business dashboard can help managers track:
- Pending work
- Purchase delays
- Project progress
- Manufacturing status
- Support tickets
- Team activities
- Delivery performance
This gives management better control over daily operations without calling every department again and again.
Reduced Manual Reporting
Many companies waste hours preparing reports manually.
Employees collect data from Excel files, WhatsApp messages, registers, emails, and different software systems. Then they clean the data, format it, and send it to management. This takes time and still may contain errors.
With properly configured ERP live dashboards, reporting becomes easier. The system pulls data from ERP modules and shows it in a useful format.
This does not mean manual review is never needed. But it reduces repetitive reporting work.
Better Accountability Across Teams
When KPIs are visible, accountability improves.
Sales teams can see targets and performance. Finance teams can track overdue invoices. Inventory teams can monitor stock accuracy. HR teams can view attendance and leaves. Support teams can track open and resolved tickets.
Dashboards make performance more transparent.
Early Problem Detection
One of the biggest benefits of real-time ERP dashboards is early problem detection.
For example:
- Sales are down this week
- Receivables are increasing
- Stock is below minimum level
- Purchase orders are delayed
- Support tickets are pending
- A project is behind schedule
- Expenses are increasing
When management sees these issues early, they can act before the problem becomes a major loss.
Key ERP Dashboards Every Business Should Have
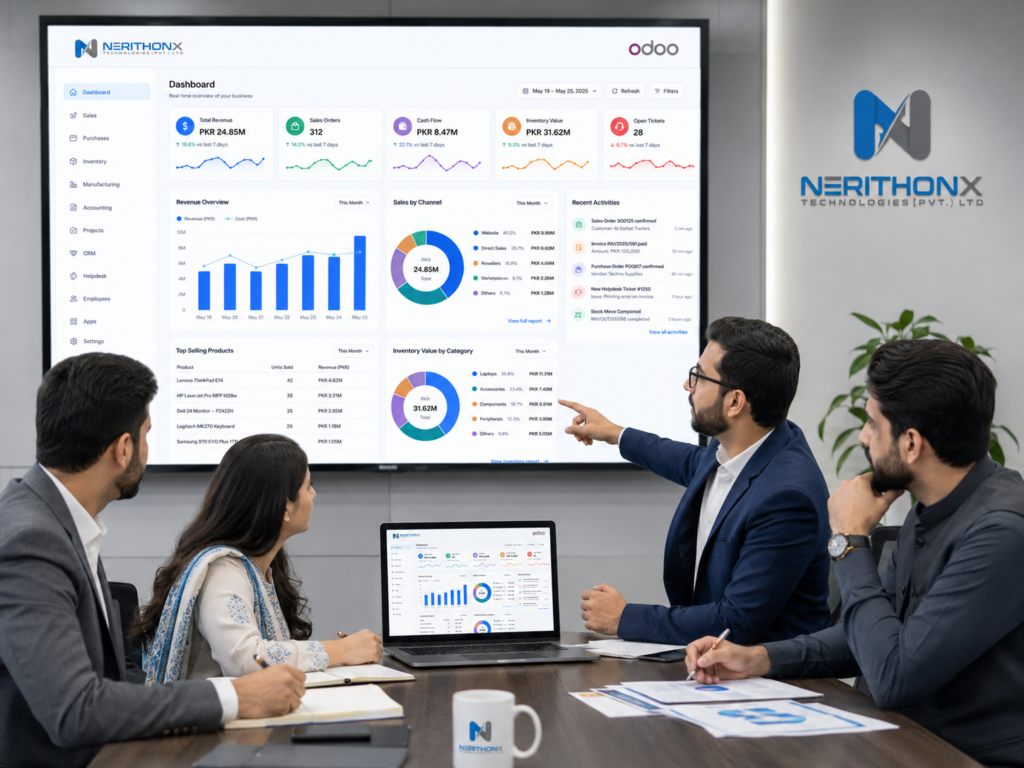
Executive Dashboard
An executive dashboard is for business owners, CEOs, directors, and top management.
It usually includes:
- Revenue
- Profitability
- Expenses
- Cash position
- Department performance
- Top KPIs
- Sales trends
- Operational summary
This dashboard gives a high-level view of the business.
Finance Dashboard
A finance dashboard is useful for accountants, finance managers, and business owners.
It can include:
- Receivables
- Payables
- Bank balance
- Invoices
- Vendor bills
- Tax summary, where configured
- Monthly revenue and expenses
This helps improve financial control and payment follow-up.
Sales Dashboard
A sales dashboard helps sales managers track team performance.
It can include:
- Leads
- Quotations
- Sales orders
- Conversion rate
- Customer activity
- Revenue
- Salesperson performance
This dashboard helps management understand sales activity clearly.
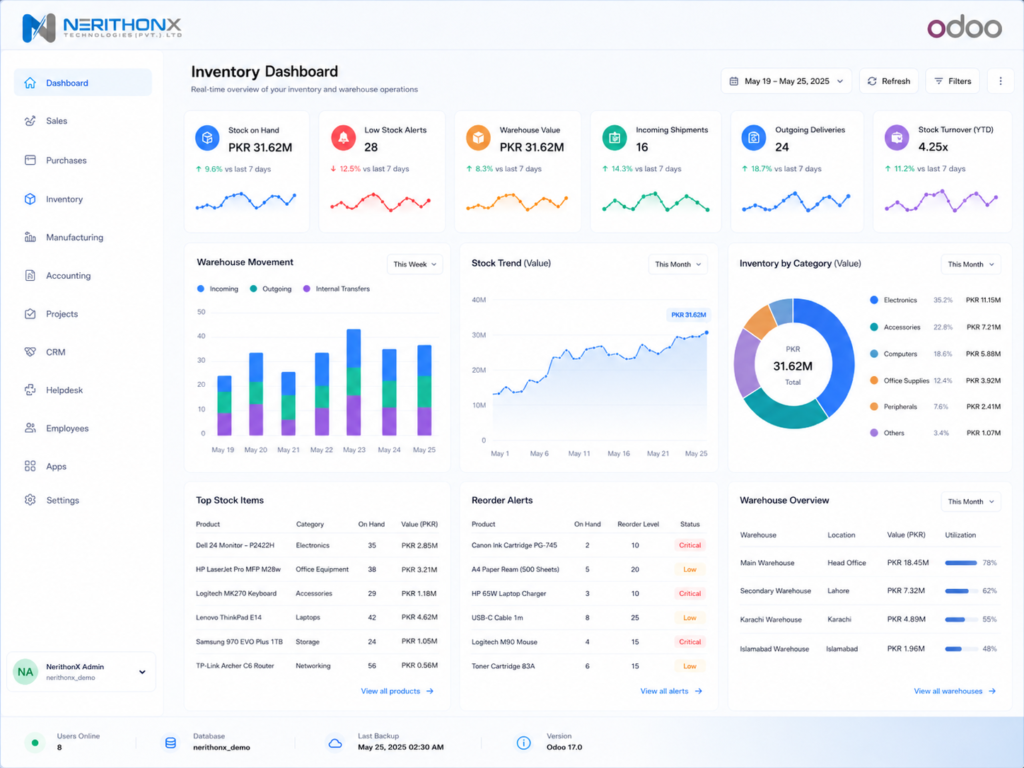
Inventory Dashboard
An inventory dashboard is useful for warehouse and operations teams.
It can include:
- Stock on hand
- Low stock
- Fast-moving products
- Dead stock
- Reordering
- Delivery status
- Warehouse movement
This helps companies avoid stock confusion and improve planning.
Purchase Dashboard
A purchase dashboard helps procurement teams track vendor and purchase activity.
It can include:
- Purchase orders
- Vendor bills
- Pending receipts
- Supplier performance
- Purchase cost trends
- Approval status
This improves purchase planning and vendor follow-up.
Manufacturing Dashboard
For production companies, manufacturing dashboards are very important.
They can show:
- Work orders
- Production status
- Raw material availability
- Finished goods
- Delays
- Production cost
This helps production managers control daily manufacturing activities.
HR Dashboard
An HR dashboard helps HR teams and management track employee-related data.
It can include:
- Attendance
- Leaves
- Payroll overview
- Employee performance
- Department headcount
This gives HR better visibility and reduces manual HR reporting.
Customer Support Dashboard
A support dashboard is useful for service-based companies.
It can include:
- Open tickets
- Resolved tickets
- Response time
- Customer satisfaction
- Pending issues
This helps improve customer service and team performance.
How Real-Time BI Works Inside an ERP System
Real-time BI inside ERP works through a simple flow:
- Users enter daily transactions in the ERP system.
- ERP stores data in one connected system.
- Reports and dashboards pull data from ERP modules.
- KPIs update based on live or scheduled refresh.
- Managers use dashboards to track performance.
- Teams take action based on insights.
The most important point is data quality.
A dashboard is only useful when users enter correct data, workflows are properly implemented, and the ERP system is configured according to business needs.
If the ERP setup is weak, dashboards will also be weak.
Real-Time BI in Odoo ERP
Odoo ERP can support business reporting and dashboard use cases through built-in reports, pivot views, graph views, spreadsheet dashboards, custom dashboards, and integrations depending on the setup. Odoo’s official Spreadsheet and Dashboards page highlights dynamic reports, pivot views, and dashboard-style reporting for business analytics.
Odoo becomes more useful when dashboards are designed according to real business workflows, not just default reports.
For example, a Pakistani distribution company may need dashboard views for sales orders, deliveries, receivables, stock movement, and branch-wise performance. A manufacturing company may need raw material availability, work order progress, finished goods, and production cost dashboards.
The right dashboard depends on the business model.
ERP Dashboards and Power BI Integration
Some companies need advanced dashboards, cross-system reporting, or visual analytics outside the ERP interface. In such cases, tools like Microsoft Power BI can be connected with ERP data depending on the business requirements, data structure, and refresh method.
Microsoft describes Power BI as a business analytics platform used to turn data into actionable insights, with tools to connect, visualize, and share data across an organization. Microsoft also provides official documentation for connecting Power BI to different data sources, configuring gateways, and managing refresh.
Power BI ERP dashboard examples may include:
- CEO dashboard
- Finance dashboard
- Sales performance dashboard
- Inventory movement dashboard
- Multi-branch dashboard
- Management reporting dashboard
This should be planned carefully. Not every company needs Power BI from day one. Some businesses can start with ERP dashboards first and move to advanced BI when reporting requirements grow.
Business Problems Solved by Live Dashboards
Live ERP dashboards help solve many common business problems:
- Delayed reporting
- Scattered data
- Manual Excel dependency
- Poor stock visibility
- Late payment tracking
- Weak sales follow-up
- No clear performance KPIs
- Department communication gaps
- Slow decision-making
- Lack of management control
When data is connected, teams work with more clarity.
Benefits of Real-Time Business Intelligence in ERP
Real-time Business Intelligence in ERP can help companies improve daily control and long-term planning.
Key benefits include:
- Faster business decisions
- Better visibility
- Improved financial control
- Stronger sales tracking
- Better inventory planning
- Reduced reporting workload
- Improved team accountability
- Clear performance measurement
- Better customer service
- Data-driven growth
The real value is not only in charts. The real value is better decision-making.
Common Mistakes Companies Make with ERP Dashboards
Many companies invest in dashboards but still do not get the right results.
Common mistakes include:
- Creating too many dashboards
- Tracking vanity metrics instead of useful KPIs
- Poor data entry discipline
- No clear dashboard owner
- Ignoring user training
- Not connecting dashboards with real workflows
- Using outdated or incorrect data
- No role-based access
- No review process after implementation
A dashboard should be simple, useful, and connected with real business decisions.
How to Plan the Right ERP Dashboard
Before creating ERP dashboards, companies should plan properly.
A practical checklist includes:
- Define business goals.
- Identify decision-makers.
- Select important KPIs.
- Clean and organize ERP data.
- Design simple dashboards.
- Set user access rights.
- Test dashboard accuracy.
- Train users.
- Review and improve dashboards regularly.
The goal is not to display everything. The goal is to display what matters.
Real-Time BI for Pakistani Businesses
Many Pakistani businesses still depend heavily on Excel sheets, WhatsApp updates, manual registers, or delayed reports.
This creates problems when sales, finance, stock, and operations are not connected. A business owner in Peshawar, Islamabad, Lahore, Karachi, or any growing market may have multiple departments working hard, but management still does not get clear visibility.
With a properly implemented ERP and live dashboards, companies can monitor business performance from one place.
For Pakistani SMEs and growing companies, ERP dashboards are especially useful because they reduce dependency on manual reporting and help management make faster decisions.
Why Choose NerithonX Technologies for ERP Dashboards and BI?
NerithonX Technologies (Pvt.) Ltd. helps businesses in Pakistan implement Odoo ERP, customize workflows, build dashboards, migrate data, train users, and support long-term ERP operations.
The company focuses on real business workflows, not just software installation.
NerithonX Technologies provides services including:
- Odoo ERP Implementation
- Odoo Customization
- Odoo Integration
- Odoo Migration
- Odoo Support and Maintenance
- Odoo Training
- Business Automation
- ERP Reporting and Dashboard Setup
- Business Intelligence Dashboard Development
As provided in the company brief, NerithonX Technologies is positioned as an Official Odoo Partner with 7+ years of experience, 20+ Odoo experts, and ERP implementation support for Pakistani businesses, especially around Peshawar and Islamabad.
Whether your business needs Odoo dashboards, ERP reporting dashboards, Power BI ERP dashboard planning, or a complete ERP dashboard implementation, NerithonX Technologies can help you design a practical reporting system based on your real workflows.
If your business wants to implement Odoo ERP dashboards, improve reporting, or build real-time Business Intelligence dashboards, NerithonX Technologies can help you design a practical dashboard system based on your real business workflows.
FAQs
1. What is real-time Business Intelligence in ERP?
Real-time Business Intelligence in ERP means using live or frequently updated ERP data to create dashboards, reports, KPIs, and insights for better decision-making.
2. What is a live ERP dashboard?
A live ERP dashboard is a visual screen that shows important business information such as sales, finance, inventory, expenses, orders, and performance KPIs.
3. Why do companies need live dashboards?
Companies need live dashboards to monitor business performance faster, reduce manual reporting, detect problems early, and make better decisions.
4. Can Odoo ERP provide live dashboards?
Yes, Odoo can support dashboards, reports, pivot views, graph views, spreadsheet dashboards, and custom dashboard use cases depending on configuration and implementation.
5. What KPIs should an ERP dashboard include?
An ERP dashboard should include useful KPIs such as revenue, expenses, receivables, payables, sales orders, stock levels, purchase status, project progress, and team performance.
6. Is Power BI useful with ERP systems?
Yes, Power BI can be useful when companies need advanced visual analytics, cross-system reporting, or management dashboards outside the ERP interface.
7. Are live dashboards useful for Pakistani businesses?
Yes, live dashboards are useful for Pakistani businesses because many companies still depend on Excel, WhatsApp updates, and delayed manual reports.
8. Why choose NerithonX Technologies for ERP dashboards and BI?
NerithonX Technologies helps businesses implement Odoo ERP, customize workflows, build dashboards, train users, and support long-term ERP reporting and automation.